CC BY 4.0 (除特别声明或转载文章外)
如果这篇博客帮助到你,可以请我喝一杯咖啡~
#导入相关包
import warnings
warnings.filterwarnings('ignore')
import numpy as np
import pandas as pd
import seaborn as sns
#设置sns样式
sns.set(style='white',context='notebook',palette='muted')
import matplotlib.pyplot as plt
#导入数据
train=pd.read_csv('train.csv')
test=pd.read_csv('test.csv')
#理解数据
print('实验数据大小:',train.shape)
print('预测数据大小:',test.shape)
实验数据大小: (891, 12)
预测数据大小: (418, 11)
#记录异常值缺失值情况
full=train.append(test,ignore_index=True)
full.describe()
| PassengerId | Survived | Pclass | Age | SibSp | Parch | Fare | |
|---|---|---|---|---|---|---|---|
| count | 1309.000000 | 891.000000 | 1309.000000 | 1046.000000 | 1309.000000 | 1309.000000 | 1308.000000 |
| mean | 655.000000 | 0.383838 | 2.294882 | 29.881138 | 0.498854 | 0.385027 | 33.295479 |
| std | 378.020061 | 0.486592 | 0.837836 | 14.413493 | 1.041658 | 0.865560 | 51.758668 |
| min | 1.000000 | 0.000000 | 1.000000 | 0.170000 | 0.000000 | 0.000000 | 0.000000 |
| 25% | 328.000000 | 0.000000 | 2.000000 | 21.000000 | 0.000000 | 0.000000 | 7.895800 |
| 50% | 655.000000 | 0.000000 | 3.000000 | 28.000000 | 0.000000 | 0.000000 | 14.454200 |
| 75% | 982.000000 | 1.000000 | 3.000000 | 39.000000 | 1.000000 | 0.000000 | 31.275000 |
| max | 1309.000000 | 1.000000 | 3.000000 | 80.000000 | 8.000000 | 9.000000 | 512.329200 |
full.info()
<class 'pandas.core.frame.DataFrame'>
RangeIndex: 1309 entries, 0 to 1308
Data columns (total 12 columns):
 #   Column       Non-Null Count  Dtype
---  ------       --------------  -----
 0   PassengerId  1309 non-null   int64
 1   Survived     891 non-null    float64
 2   Pclass       1309 non-null   int64
 3   Name         1309 non-null   object
 4   Sex          1309 non-null   object
 5   Age          1046 non-null   float64
 6   SibSp        1309 non-null   int64
 7   Parch        1309 non-null   int64
 8   Ticket       1309 non-null   object
 9   Fare         1308 non-null   float64
 10  Cabin        295 non-null    object
 11  Embarked     1307 non-null   object
dtypes: float64(3), int64(4), object(5)
memory usage: 122.8+ KB
# Age Fare Cabin Embarked 均有缺失
查看特征与标签间的关系
3.2.1 Embarked与Survived:法国登船的乘客生存率较
sns.barplot(data=train,x='Embarked',y='Survived')
<matplotlib.axes._subplots.AxesSubplot at 0x194d2300250>

#计算不同类型embarked的乘客,其生存率为多少
print('Embarked为"S"的乘客,其生存率为%.2f'%full['Survived'][full['Embarked']=='S'].value_counts(normalize=True)[1])
print('Embarked为"C"的乘客,其生存率为%.2f'%full['Survived'][full['Embarked']=='C'].value_counts(normalize=True)[1])
print('Embarked为"Q"的乘客,其生存率为%.2f'%full['Survived'][full['Embarked']=='Q'].value_counts(normalize=True)[1])
#'C','Q'代码类同'S',这里不赘述啦
Embarked为"S"的乘客,其生存率为0.34
Embarked为"C"的乘客,其生存率为0.55
Embarked为"Q"的乘客,其生存率为0.39
# 法国登船乘客生存率较高原因可能与其头等舱乘客比例较高有关,因此继续查看不同登船地点乘客各舱位乘客数量情况。
sns.factorplot('Pclass',col='Embarked',data=train,kind='count',size=3)
<seaborn.axisgrid.FacetGrid at 0x194d239b190>

3.2.2 Parch与Survived:当乘客同行的父母及子女数量适中时,生存率较高
sns.barplot(data=train,x='Parch',y='Survived')
<matplotlib.axes._subplots.AxesSubplot at 0x194d24b6bb0>

3.2.3 SibSp与Survived:当乘客同行的同辈数量适中时生存率较高
sns.barplot(data=train,x='SibSp',y='Survived')
<matplotlib.axes._subplots.AxesSubplot at 0x194d24e6c10>

3.2.4 Pclass与Survived:乘客客舱等级越高,生存率越高
sns.barplot(data=train,x='Pclass',y='Survived')
<matplotlib.axes._subplots.AxesSubplot at 0x194d259bdc0>

3.2.5 Sex与Survived:女性的生存率远高于男性
sns.barplot(data=train,x='Sex',y='Survived')
<matplotlib.axes._subplots.AxesSubplot at 0x194d260d100>

3.2.6 Age与Survived:当乘客年龄段在0-10岁期间时生存率会较高
#创建坐标轴
ageFacet=sns.FacetGrid(train,hue='Survived',aspect=3)
#作图,选择图形类型
ageFacet.map(sns.kdeplot,'Age',shade=True)
#其他信息:坐标轴范围、标签等
ageFacet.set(xlim=(0,train['Age'].max()))
ageFacet.add_legend()
<seaborn.axisgrid.FacetGrid at 0x194d26558b0>

3.2.7 Fare与Survived:当票价低于18左右时乘客生存率较低,票价越高生存率一般越高
ageFacet=sns.FacetGrid(train,hue='Survived',aspect=3)
ageFacet.map(sns.kdeplot,'Fare',shade=True)
ageFacet.set(xlim=(0,150))
ageFacet.add_legend()
<seaborn.axisgrid.FacetGrid at 0x194d26cb610>

查看票价的分布特征
farePlot=sns.distplot(full['Fare'][full['Fare'].notnull()],label='skewness:%.2f'%(full['Fare'].skew()))
farePlot.legend(loc='best')
<matplotlib.legend.Legend at 0x194d2720730>

fare的分布呈左偏的形态,其偏度skewness=4.37较大,说明数据偏移平均值较多,因此我们需要对数据进行对数化处理,防止数据权重分布不均匀。
#对数化处理fare值
full['Fare']=full['Fare'].map(lambda x: np.log(x) if x>0 else 0)
4.数据预处理
4.1.1Cabin缺失值填充
full['Cabin']=full['Cabin'].fillna('U')
full['Cabin'].head()
0       U
1     C85
2       U
3    C123
4       U
Name: Cabin, dtype: object
4.1.2Embarked缺失值填充
#对Embarked缺失值进行处理,查看缺失值情况
full[full['Embarked'].isnull()]
| PassengerId | Survived | Pclass | Name | Sex | Age | SibSp | Parch | Ticket | Fare | Cabin | Embarked | |
|---|---|---|---|---|---|---|---|---|---|---|---|---|
| 61 | 62 | 1.0 | 1 | Icard, Miss. Amelie | female | 38.0 | 0 | 0 | 113572 | 4.382027 | B28 | NaN |
| 829 | 830 | 1.0 | 1 | Stone, Mrs. George Nelson (Martha Evelyn) | female | 62.0 | 0 | 0 | 113572 | 4.382027 | B28 | NaN |
full['Embarked'].value_counts()
full['Embarked']=full['Embarked'].fillna('S')
4.1.3Fare缺失值填充
full[full['Fare'].isnull()]
| PassengerId | Survived | Pclass | Name | Sex | Age | SibSp | Parch | Ticket | Fare | Cabin | Embarked |
|---|
full['Fare']=full['Fare'].fillna(full[(full['Pclass']==3)&(full['Embarked']=='S')&(full['Cabin']=='U')]['Fare'].mean())
4.2特征工程
4.2.1 Name中的头衔信息-Title
full['Title']=full['Name'].map(lambda x:x.split(',')[1].split('.')[0].strip())
#查看title数据分布
full['Title'].value_counts()
Mr              757
Miss            260
Mrs             197
Master           61
Rev               8
Dr                8
Col               4
Mlle              2
Major             2
Ms                2
the Countess      1
Dona              1
Jonkheer          1
Lady              1
Capt              1
Don               1
Sir               1
Mme               1
Name: Title, dtype: int64
TitleDict={}
TitleDict['Mr']='Mr'
TitleDict['Mlle']='Miss'
TitleDict['Miss']='Miss'
TitleDict['Master']='Master'
TitleDict['Jonkheer']='Master'
TitleDict['Mme']='Mrs'
TitleDict['Ms']='Mrs'
TitleDict['Mrs']='Mrs'
TitleDict['Don']='Royalty'
TitleDict['Sir']='Royalty'
TitleDict['the Countess']='Royalty'
TitleDict['Dona']='Royalty'
TitleDict['Lady']='Royalty'
TitleDict['Capt']='Officer'
TitleDict['Col']='Officer'
TitleDict['Major']='Officer'
TitleDict['Dr']='Officer'
TitleDict['Rev']='Officer'

full['Title']=full['Title'].map(TitleDict)
full['Title'].value_counts()
Mr         757
Miss       262
Mrs        200
Master      62
Officer     23
Royalty      5
Name: Title, dtype: int64
sns.barplot(data=full,x='Title',y='Survived')
<matplotlib.axes._subplots.AxesSubplot at 0x194d2400d60>

4.2.2 FamilyNum及FamilySize信息
full['familyNum']=full['Parch']+full['SibSp']+1
#查看familyNum与Survived
sns.barplot(data=full,x='familyNum',y='Survived')
<matplotlib.axes._subplots.AxesSubplot at 0x194d27af580>

def familysize(familyNum):
    if familyNum==1:
        return 0
    elif (familyNum>=2)&(familyNum<=4):
        return 1
    else:
        return 2

full['familySize']=full['familyNum'].map(familysize)
full['familySize'].value_counts()
0    790
1    437
2     82
Name: familySize, dtype: int64
sns.barplot(data=full,x='familySize',y='Survived')
<matplotlib.axes._subplots.AxesSubplot at 0x194d28d4be0>

4.2.3 Cabin客舱类型信息-Deck
full['Deck']=full['Cabin'].map(lambda x:x[0])
#查看不同Deck类型乘客的生存率
sns.barplot(data=full,x='Deck',y='Survived')
<matplotlib.axes._subplots.AxesSubplot at 0x194d2929610>

4.2.4 共票号乘客数量TickCot及TickGroup
TickCountDict={}
TickCountDict=full['Ticket'].value_counts()
TickCountDict.head()
CA. 2343        11
1601             8
CA 2144          8
3101295          7
S.O.C. 14879     7
Name: Ticket, dtype: int64
#将同票号乘客数量数据并入数据集中
full['TickCot']=full['Ticket'].map(TickCountDict)
full['TickCot'].head()
0    1
1    2
2    1
3    2
4    1
Name: TickCot, dtype: int64
#查看TickCot与Survived之间关系
sns.barplot(data=full,x='TickCot',y='Survived')
<matplotlib.axes._subplots.AxesSubplot at 0x194d2998c70>

#按照TickCot大小,将TickGroup分为三类。
def TickCountGroup(num):
    if (num>=2)&(num<=4):
        return 0
    elif (num==1)|((num>=5)&(num<=8)):
        return 1
    else :
        return 2
#得到各位乘客TickGroup的类别
full['TickGroup']=full['TickCot'].map(TickCountGroup)
#查看TickGroup与Survived之间关系
sns.barplot(data=full,x='TickGroup',y='Survived')
<matplotlib.axes._subplots.AxesSubplot at 0x194d2a16520>

4.2.5Age缺失值填充-构建随机森林模型预测缺失的数据
full[full['Age'].isnull()].head()
| PassengerId | Survived | Pclass | Name | Sex | Age | SibSp | Parch | Ticket | Fare | Cabin | Embarked | Title | familyNum | familySize | Deck | TickCot | TickGroup | |
|---|---|---|---|---|---|---|---|---|---|---|---|---|---|---|---|---|---|---|
| 5 | 6 | 0.0 | 3 | Moran, Mr. James | male | NaN | 0 | 0 | 330877 | 2.135148 | U | Q | Mr | 1 | 0 | U | 1 | 1 |
| 17 | 18 | 1.0 | 2 | Williams, Mr. Charles Eugene | male | NaN | 0 | 0 | 244373 | 2.564949 | U | S | Mr | 1 | 0 | U | 1 | 1 |
| 19 | 20 | 1.0 | 3 | Masselmani, Mrs. Fatima | female | NaN | 0 | 0 | 2649 | 1.977547 | U | C | Mrs | 1 | 0 | U | 1 | 1 |
| 26 | 27 | 0.0 | 3 | Emir, Mr. Farred Chehab | male | NaN | 0 | 0 | 2631 | 1.977547 | U | C | Mr | 1 | 0 | U | 1 | 1 |
| 28 | 29 | 1.0 | 3 | O'Dwyer, Miss. Ellen "Nellie" | female | NaN | 0 | 0 | 330959 | 2.064226 | U | Q | Miss | 1 | 0 | U | 1 | 1 |
AgePre=full[['Age','Parch','Pclass','SibSp','Title','familyNum','TickCot']]
#进行one-hot编码
AgePre=pd.get_dummies(AgePre)
ParAge=pd.get_dummies(AgePre['Parch'],prefix='Parch')
SibAge=pd.get_dummies(AgePre['SibSp'],prefix='SibSp')
PclAge=pd.get_dummies(AgePre['Pclass'],prefix='Pclass')
#查看变量间相关性
AgeCorrDf=pd.DataFrame()
AgeCorrDf=AgePre.corr()
AgeCorrDf['Age'].sort_values()

#拼接数据
AgePre=pd.concat([AgePre,ParAge,SibAge,PclAge],axis=1)
AgePre.head()
| Age | Parch | Pclass | SibSp | familyNum | TickCot | Title_Master | Title_Miss | Title_Mr | Title_Mrs | ... | SibSp_0 | SibSp_1 | SibSp_2 | SibSp_3 | SibSp_4 | SibSp_5 | SibSp_8 | Pclass_1 | Pclass_2 | Pclass_3 | |
|---|---|---|---|---|---|---|---|---|---|---|---|---|---|---|---|---|---|---|---|---|---|
| 0 | 22.0 | 0 | 3 | 1 | 2 | 1 | 0 | 0 | 1 | 0 | ... | 0 | 1 | 0 | 0 | 0 | 0 | 0 | 0 | 0 | 1 |
| 1 | 38.0 | 0 | 1 | 1 | 2 | 2 | 0 | 0 | 0 | 1 | ... | 0 | 1 | 0 | 0 | 0 | 0 | 0 | 1 | 0 | 0 |
| 2 | 26.0 | 0 | 3 | 0 | 1 | 1 | 0 | 1 | 0 | 0 | ... | 1 | 0 | 0 | 0 | 0 | 0 | 0 | 0 | 0 | 1 |
| 3 | 35.0 | 0 | 1 | 1 | 2 | 2 | 0 | 0 | 0 | 1 | ... | 0 | 1 | 0 | 0 | 0 | 0 | 0 | 1 | 0 | 0 |
| 4 | 35.0 | 0 | 3 | 0 | 1 | 1 | 0 | 0 | 1 | 0 | ... | 1 | 0 | 0 | 0 | 0 | 0 | 0 | 0 | 0 | 1 |
5 rows × 30 columns
#拆分实验集和预测集
AgeKnown=AgePre[AgePre['Age'].notnull()]
AgeUnKnown=AgePre[AgePre['Age'].isnull()]

#生成实验数据的特征和标签
AgeKnown_X=AgeKnown.drop(['Age'],axis=1)
AgeKnown_y=AgeKnown['Age']
#生成预测数据的特征
AgeUnKnown_X=AgeUnKnown.drop(['Age'],axis=1)

#利用随机森林构建模型
from sklearn.ensemble import RandomForestRegressor
rfr=RandomForestRegressor(random_state=None,n_estimators=500,n_jobs=-1)
rfr.fit(AgeKnown_X,AgeKnown_y)
RandomForestRegressor(n_estimators=500, n_jobs=-1)
3、利用模型进行预测并填入原数据集中
rfr.score(AgeKnown_X,AgeKnown_y)
0.5875085143761927
#预测年龄
AgeUnKnown_y=rfr.predict(AgeUnKnown_X)
#填充预测数据
full.loc[full['Age'].isnull(),['Age']]=AgeUnKnown_y
full.info()  #此时已无缺失值
<class 'pandas.core.frame.DataFrame'>
RangeIndex: 1309 entries, 0 to 1308
Data columns (total 18 columns):
 #   Column       Non-Null Count  Dtype
---  ------       --------------  -----
 0   PassengerId  1309 non-null   int64
 1   Survived     891 non-null    float64
 2   Pclass       1309 non-null   int64
 3   Name         1309 non-null   object
 4   Sex          1309 non-null   object
 5   Age          1309 non-null   float64
 6   SibSp        1309 non-null   int64
 7   Parch        1309 non-null   int64
 8   Ticket       1309 non-null   object
 9   Fare         1309 non-null   float64
 10  Cabin        1309 non-null   object
 11  Embarked     1309 non-null   object
 12  Title        1309 non-null   object
 13  familyNum    1309 non-null   int64
 14  familySize   1309 non-null   int64
 15  Deck         1309 non-null   object
 16  TickCot      1309 non-null   int64
 17  TickGroup    1309 non-null   int64
dtypes: float64(3), int64(8), object(7)
memory usage: 184.2+ KB
4.3同组识别
#提取乘客的姓氏及相应的乘客数
full['Surname']=full['Name'].map(lambda x:x.split(',')[0].strip())
SurNameDict={}
SurNameDict=full['Surname'].value_counts()
full['SurnameNum']=full['Surname'].map(SurNameDict)

#将数据分为两组
MaleDf=full[(full['Sex']=='male')&(full['Age']>12)&(full['familyNum']>=2)]
FemChildDf=full[((full['Sex']=='female')|(full['Age']<=12))&(full['familyNum']>=2)]
#分析男性同组效应
MSurNamDf=MaleDf['Survived'].groupby(MaleDf['Surname']).mean()
MSurNamDf.head()
MSurNamDf.value_counts()
0.0    89
1.0    19
0.5     3
Name: Survived, dtype: int64
MSurNamDict={}
MSurNamDict=MSurNamDf[MSurNamDf.values==1].index
MSurNamDict
Index(['Beane', 'Beckwith', 'Bishop', 'Cardeza', 'Chambers', 'Dick',
       'Duff Gordon', 'Frauenthal', 'Frolicher-Stehli', 'Goldenberg',
       'Greenfield', 'Harder', 'Hoyt', 'Kimball', 'Lindqvist', 'McCoy',
       'Nakid', 'Persson', 'Taylor'],
      dtype='object', name='Surname')
FCSurNamDf=FemChildDf['Survived'].groupby(FemChildDf['Surname']).mean()
FCSurNamDf.head()
FCSurNamDf.value_counts()
1.000000    115
0.000000     27
0.750000      2
0.333333      1
0.142857      1
Name: Survived, dtype: int64
FCSurNamDict={}
FCSurNamDict=FCSurNamDf[FCSurNamDf.values==0].index
FCSurNamDict
Index(['Ahlin', 'Arnold-Franchi', 'Barbara', 'Boulos', 'Bourke', 'Caram',
       'Danbom', 'Ford', 'Goodwin', 'Ilmakangas', 'Johnston', 'Jussila',
       'Lahtinen', 'Lefebre', 'Lobb', 'Palsson', 'Panula', 'Rice', 'Robins',
       'Rosblom', 'Sage', 'Skoog', 'Strom', 'Turpin', 'Van Impe',
       'Vander Planke', 'Zabour'],
      dtype='object', name='Surname')
full.loc[(full['Survived'].isnull())&(full['Surname'].isin(MSurNamDict))&(full['Sex']=='male'),'Age']=5
full.loc[(full['Survived'].isnull())&(full['Surname'].isin(MSurNamDict))&(full['Sex']=='male'),'Sex']='female'

#对数据集中这些姓氏的女性及儿童的数据进行修正:1、性别改为男;2、年龄改为60。
full.loc[(full['Survived'].isnull())&(full['Surname'].isin(FCSurNamDict))&((full['Sex']=='female')|(full['Age']<=12)),'Age']=60
full.loc[(full['Survived'].isnull())&(full['Surname'].isin(FCSurNamDict))&((full['Sex']=='female')|(full['Age']<=12)),'Sex']='male'
4.4筛选子集
#人工筛选
fullSel=full.drop(['Cabin','Name','Ticket','PassengerId','Surname','SurnameNum'],axis=1)
#查看各特征与标签的相关性
corrDf=pd.DataFrame()
corrDf=fullSel.corr()
corrDf['Survived'].sort_values(ascending=True)
Pclass       -0.338481
TickGroup    -0.319278
Age          -0.059792
SibSp        -0.035322
familyNum     0.016639
TickCot       0.064962
Parch         0.081629
familySize    0.108631
Fare          0.331805
Survived      1.000000
Name: Survived, dtype: float64
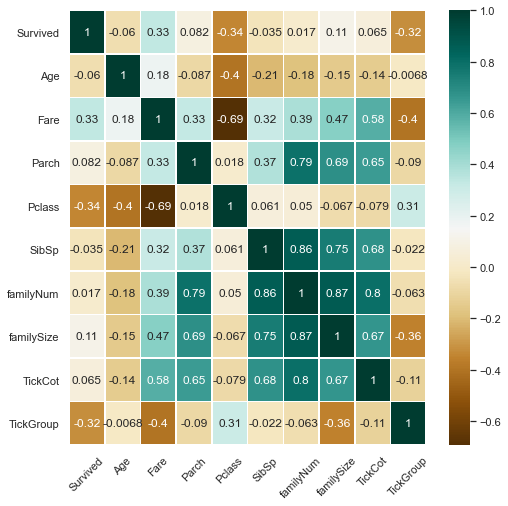
#热力图,查看Survived与其他特征间相关性大小
plt.figure(figsize=(8,8))
sns.heatmap(fullSel[['Survived','Age','Embarked','Fare','Parch','Pclass',
                    'Sex','SibSp','Title','familyNum','familySize','Deck',
                     'TickCot','TickGroup']].corr(),cmap='BrBG',annot=True,
           linewidths=.5)
plt.xticks(rotation=45)
(array([0.5, 1.5, 2.5, 3.5, 4.5, 5.5, 6.5, 7.5, 8.5, 9.5]),
 <a list of 10 Text major ticklabel objects>)

fullSel=fullSel.drop(['familyNum','SibSp','TickCot','Parch'],axis=1)
#one-hot编码
fullSel=pd.get_dummies(fullSel)
PclassDf=pd.get_dummies(full['Pclass'],prefix='Pclass')
TickGroupDf=pd.get_dummies(full['TickGroup'],prefix='TickGroup')
familySizeDf=pd.get_dummies(full['familySize'],prefix='familySize')

fullSel=pd.concat([fullSel,PclassDf,TickGroupDf,familySizeDf],axis=1)
5.构建模型
本文先比较了SCV/Decision Tree/Gradient Boosting/Neural network/KNN/Logistic Regression等多种机器学习算法的结果,并对表现较好的Gradient Boosting及Logistic Regression做进一步的对比,最终选择Gradient Boosting对乘客生存率进行预测。
5.1模型选择
主要考虑使用以下常用的机器学习算法进行比较:
- SCV
- Decision Tree
- Extra Trees
- Gradient Boosting
- Random Forest
- KNN
- Logistic Regression
- Linear Discriminant Analysis
#拆分实验数据与预测数据
experData=fullSel[fullSel['Survived'].notnull()]
preData=fullSel[fullSel['Survived'].isnull()]

experData_X=experData.drop('Survived',axis=1)
experData_y=experData['Survived']
preData_X=preData.drop('Survived',axis=1)

#导入机器学习算法库
from sklearn.ensemble import RandomForestClassifier,GradientBoostingClassifier,ExtraTreesClassifier
from sklearn.discriminant_analysis import LinearDiscriminantAnalysis
from sklearn.linear_model import LogisticRegression
from sklearn.neighbors import KNeighborsClassifier
from sklearn.tree import DecisionTreeClassifier
from sklearn.svm import SVC
from sklearn.model_selection import GridSearchCV,cross_val_score,StratifiedKFold

#设置kfold,交叉采样法拆分数据集
kfold=StratifiedKFold(n_splits=10)

#汇总不同模型算法
classifiers=[]
classifiers.append(SVC())
classifiers.append(DecisionTreeClassifier())
classifiers.append(RandomForestClassifier())
classifiers.append(ExtraTreesClassifier())
classifiers.append(GradientBoostingClassifier())
classifiers.append(KNeighborsClassifier())
classifiers.append(LogisticRegression())
classifiers.append(LinearDiscriminantAnalysis())
5.1.2比较各种算法结果,进一步选择模型
#不同机器学习交叉验证结果汇总
cv_results=[]
for classifier in classifiers:
    cv_results.append(cross_val_score(classifier,experData_X,experData_y,
                                      scoring='accuracy',cv=kfold,n_jobs=-1))
#求出模型得分的均值和标准差
cv_means=[]
cv_std=[]
for cv_result in cv_results:
    cv_means.append(cv_result.mean())
    cv_std.append(cv_result.std())

#汇总数据
cvResDf=pd.DataFrame({'cv_mean':cv_means,
                     'cv_std':cv_std,
                     'algorithm':['SVC','DecisionTreeCla','RandomForestCla','ExtraTreesCla',
                                  'GradientBoostingCla','KNN','LR','LinearDiscrimiAna']})

cvResDf
| cv_mean | cv_std | algorithm | |
|---|---|---|---|
| 0 | 0.764419 | 0.050512 | SVC |
| 1 | 0.778976 | 0.058657 | DecisionTreeCla |
| 2 | 0.815980 | 0.043057 | RandomForestCla |
| 3 | 0.799139 | 0.045985 | ExtraTreesCla |
| 4 | 0.837291 | 0.041373 | GradientBoostingCla |
| 5 | 0.794657 | 0.038325 | KNN |
| 6 | 0.827191 | 0.031660 | LR |
| 7 | 0.823833 | 0.029460 | LinearDiscrimiAna |
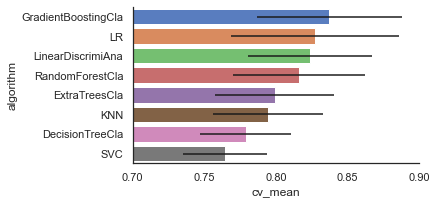
# sns.barplot(data=cvResDf,x='cv_mean',y='algorithm',**{'xerr':cv_std})

cvResFacet=sns.FacetGrid(cvResDf.sort_values(by='cv_mean',ascending=False),sharex=False,
            sharey=False,aspect=2)
cvResFacet.map(sns.barplot,'cv_mean','algorithm',**{'xerr':cv_std},
               palette='muted')
cvResFacet.set(xlim=(0.7,0.9))
cvResFacet.add_legend()
<seaborn.axisgrid.FacetGrid at 0x194d5419880>

5.1.3模型调优
综合以上模型表现,考虑选择GradientBoostingCla、LR两种模型进一步对比。
分别建立GradientBoostingClassifier以及LogisticRegression模型,并进行模型调优。
#GradientBoostingClassifier模型
GBC = GradientBoostingClassifier()
gb_param_grid = {'loss' : ["deviance"],
              'n_estimators' : [100,200,300],
              'learning_rate': [0.1, 0.05, 0.01],
              'max_depth': [4, 8],
              'min_samples_leaf': [100,150],
              'max_features': [0.3, 0.1]
              }
modelgsGBC = GridSearchCV(GBC,param_grid = gb_param_grid, cv=kfold,
                                     scoring="accuracy", n_jobs= -1, verbose = 1)
modelgsGBC.fit(experData_X,experData_y)

#LogisticRegression模型
modelLR=LogisticRegression()
LR_param_grid = {'C' : [1,2,3],
                'penalty':['l1','l2']}
modelgsLR = GridSearchCV(modelLR,param_grid = LR_param_grid, cv=kfold,
                                     scoring="accuracy", n_jobs= -1, verbose = 1)
modelgsLR.fit(experData_X,experData_y)
Fitting 10 folds for each of 72 candidates, totalling 720 fits


[Parallel(n_jobs=-1)]: Using backend LokyBackend with 8 concurrent workers.
[Parallel(n_jobs=-1)]: Done  52 tasks      | elapsed:    2.1s
[Parallel(n_jobs=-1)]: Done 272 tasks      | elapsed:   13.3s
[Parallel(n_jobs=-1)]: Done 522 tasks      | elapsed:   27.9s
[Parallel(n_jobs=-1)]: Done 720 out of 720 | elapsed:   38.1s finished


Fitting 10 folds for each of 6 candidates, totalling 60 fits


[Parallel(n_jobs=-1)]: Using backend LokyBackend with 8 concurrent workers.
[Parallel(n_jobs=-1)]: Done  60 out of  60 | elapsed:    0.6s finished


GridSearchCV(cv=StratifiedKFold(n_splits=10, random_state=None, shuffle=False),
             estimator=LogisticRegression(), n_jobs=-1,
             param_grid={'C': [1, 2, 3], 'penalty': ['l1', 'l2']},
             scoring='accuracy', verbose=1)
5.2 查看模型得分
1、查看模型准确度
#modelgsGBC模型
print('modelgsGBC模型得分为:%.3f'%modelgsGBC.best_score_)
#modelgsLR模型
print('modelgsLR模型得分为:%.3f'%modelgsLR.best_score_)
modelgsGBC模型得分为:0.842
modelgsLR模型得分为:0.828
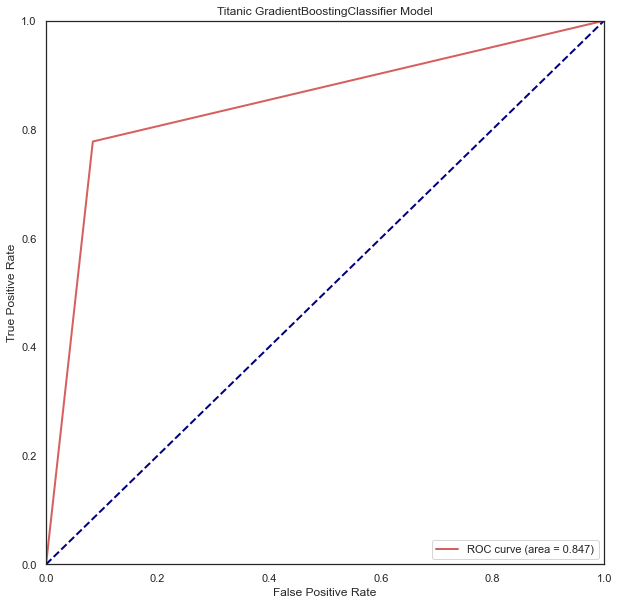
#查看模型ROC曲线
#求出测试数据模型的预测值
modelgsGBCtestpre_y=modelgsGBC.predict(experData_X).astype(int)
#画图
from sklearn.metrics import roc_curve, auc  ###计算roc和auc
# Compute ROC curve and ROC area for each class
fpr,tpr,threshold = roc_curve(experData_y, modelgsGBCtestpre_y) ###计算真正率和假正率
roc_auc = auc(fpr,tpr) ###计算auc的值

plt.figure()
lw = 2
plt.figure(figsize=(10,10))
plt.plot(fpr, tpr, color='r',
         lw=lw, label='ROC curve (area = %0.3f)' % roc_auc) ###假正率为横坐标,真正率为纵坐标做曲线
plt.plot([0, 1], [0, 1], color='navy', lw=lw, linestyle='--')
plt.xlim([0.0, 1.0])
plt.ylim([0.0, 1.0])
plt.xlabel('False Positive Rate')
plt.ylabel('True Positive Rate')
plt.title('Titanic GradientBoostingClassifier Model')
plt.legend(loc="lower right")
plt.show()
<Figure size 432x288 with 0 Axes>

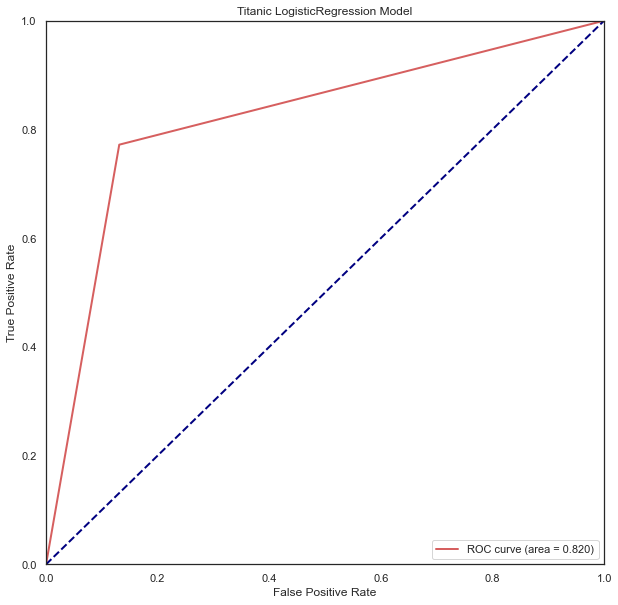
#查看模型ROC曲线
#求出测试数据模型的预测值
testpre_y=modelgsLR.predict(experData_X).astype(int)
#画图
from sklearn.metrics import roc_curve, auc  ###计算roc和auc
# Compute ROC curve and ROC area for each class
fpr,tpr,threshold = roc_curve(experData_y, testpre_y) ###计算真正率和假正率
roc_auc = auc(fpr,tpr) ###计算auc的值

plt.figure()
lw = 2
plt.figure(figsize=(10,10))
plt.plot(fpr, tpr, color='r',
         lw=lw, label='ROC curve (area = %0.3f)' % roc_auc) ###假正率为横坐标,真正率为纵坐标做曲线
plt.plot([0, 1], [0, 1], color='navy', lw=lw, linestyle='--')
plt.xlim([0.0, 1.0])
plt.ylim([0.0, 1.0])
plt.xlabel('False Positive Rate')
plt.ylabel('True Positive Rate')
plt.title('Titanic LogisticRegression Model')
plt.legend(loc="lower right")
plt.show()
<Figure size 432x288 with 0 Axes>

from sklearn.metrics import confusion_matrix
print('GradientBoostingClassifier模型混淆矩阵为\n',confusion_matrix(experData_y.astype(int).astype(str),modelgsGBCtestpre_y.astype(str)))
print('LinearRegression模型混淆矩阵为\n',confusion_matrix(experData_y.astype(int).astype(str),testpre_y.astype(str)))
GradientBoostingClassifier模型混淆矩阵为
 [[503  46]
 [ 76 266]]
LinearRegression模型混淆矩阵为
 [[477  72]
 [ 78 264]]
#TitanicGBSmodle
GBCpreData_y=modelgsGBC.predict(preData_X)
GBCpreData_y=GBCpreData_y.astype(int)
#导出预测结果
GBCpreResultDf=pd.DataFrame()
GBCpreResultDf['PassengerId']=full['PassengerId'][full['Survived'].isnull()]
GBCpreResultDf['Survived']=GBCpreData_y
GBCpreResultDf
#将预测结果导出为csv文件
GBCpreResultDf.to_csv('TitanicGBSmodle.csv',index=False)
